


The price of Bitcoin took a hit and even fell below $60,000. BTC could gain bearish momentum if there is a daily close below the $60,000 support zone.
- Bitcoin started a fresh decline and traded below the $61,200 zone.
- The price is trading below $62,000 and the 100 hourly simple moving average.
- There is a connected downtrend line with resistance at $60,400 on the hourly chart of the BTC/USD pair (Kraken data feed).
- The pair could accelerate lower if it fails to recover above $60,400 and then $62,000 this week.
Bitcoin price hits support
Bitcoin price began a further decline below the $62,500 support level. BTC fell below the $61,200 level as the bears took control. They even managed to get the price below $60,000.
A low formed at $59,110 and the price is now consolidating its losses. There was a slight increase above the $60,000 level and the 23.6% Fibonacci retracement level of the recent decline from the $64,738 high to $59,110 low.
Bitcoin is now trading below $61,500 and the 100 hourly simple moving average. Immediate resistance is near the $60,400 level. There is also a downtrend line forming with resistance at $60,400 on the hourly chart of the BTC/USD pair.
The first major resistance could be $61,200. The next key resistance could be $62,000 or the 50% Fibonacci retracement level of the recent decline from the $64,738 high to $59,110 low.
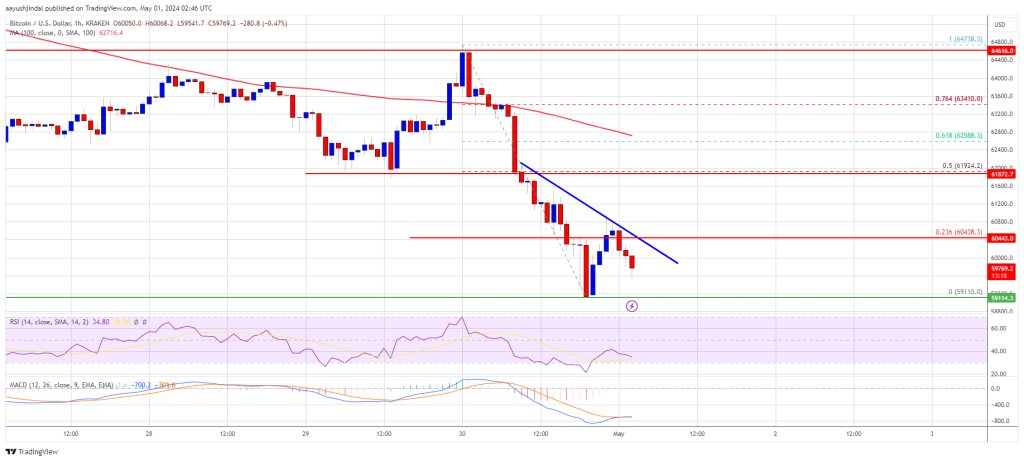
Source: BTCUSD on TradingView.com
A sharp move above the $62,000 resistance could send the price higher. The next resistance now lies at $62,500. If there is a clear move above the $62,500 resistance zone, the price could continue to rise. In the case mentioned, the price could reach $64,000.
More disadvantages in BTC?
If Bitcoin fails to rise above the $60,400 resistance zone, it could continue to decline. Immediate downside support is near the $59,500 level.
The first major support is $59,100. If there is a close below $59,100, the price could start to decline towards $58,000. Any further losses could send the price towards the $56,400 support zone in the near term.
Technical indicators:
Hourly MACD – The MACD is now accelerating into the bearish zone.
Hourly RSI (Relative Strength Index) – The RSI for BTC/USD is now below the 50 level.
Major support levels – $59,500, followed by $59,100.
Major resistance levels – $60,400, $61,200 and $62,000.